
Surface Plot
To better visualize the pixel values in the image use the surface plot function. The surface plot uses the pixels intensity as a Y axis offset and plots the location using a white pixel. The end effect is a 3-D like surface plot that can be used to see how processing is affecting pixel rows in more detail.
Interface
Instructions
1. To increase/decrease the maximum Y offset change the
"Height" value.
2. To increase/decrease the row sampling change the "Spacing" value.
Example
| Source | Surface Plot |
 | 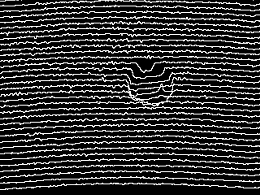 |
To see how filters can affect pixel values crop the entire image to a single row and use the surface plot to plot the single row. Prefixing filters before the crop and surface plot can help indicate how filters affect pixel values.
| New Post |
| Surface_Plot Related Forum Posts | Last post | Posts | Views |
| None |